There's nothing more frustrating that your node.js app leaking memory. If you're coming here because of Heroku R14 / R15 errors, take some deep breaths, it'll be okay. Heroku's smart enough to swap to disk when this happens, and will kill and restart your app if things get absolutely wild.
Background
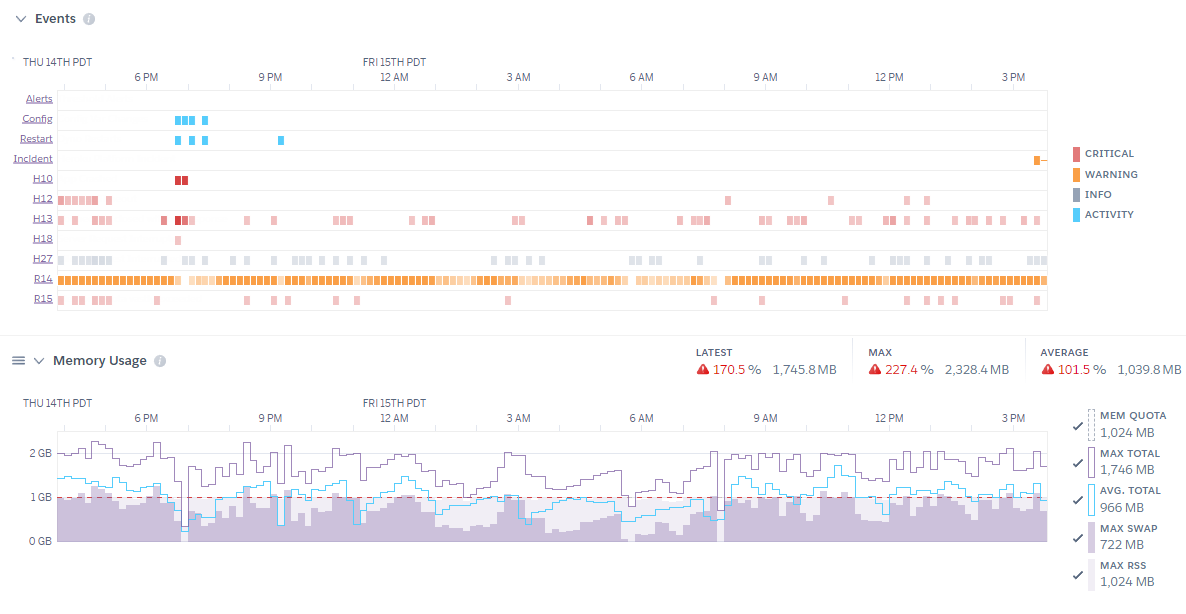
It started with my email box getting pelted with warnings that the memory quota on a project I advise for was getting hit with R14 errors. Going to the Heroku metrics page confirmed that yes, something was clearly wrong. In the above picture, you can see again and again the memory usage surge and then Heroku responding with an R15 and force rebooting the server. Moments later, the memory usage was growing again.
It's a Memory Leak, Ruin of Productivity and afternoons. 😭
However, since the last time I dealt with a memory leak (2011) the tools have come a long way. So here's how you triage a production memory issue, run analysis against your currently leaking production boxes, and stamp out the issue.
Modern Tools
The tools for dealing with a memory leak have gotten much better, especially if you're on Heroku. You only need two:
- A current version of Chrome (which comes with the amazing v8 debugger)
- The Heroku CLI (if on Heroku)
The first does 90% of the heavy lifting, while the second now has all the commands we need to turn on a debugger in production and forward debug data to our local machine. Make sure you've logged in to the Heroku CLI if you're triaging Heroku.
Opening Chrome's Inspector
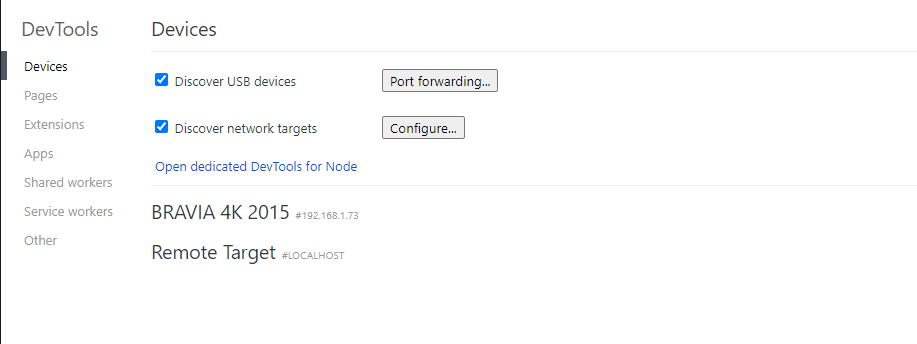
The Chrome Developer Tools are always available on chrome://inspect, which can be put in your browser's address bar. The DevTools are useful for debugging everything from node.js processes to Service workers. For now, we want to stay on the Devices tab, make sure Discover network targets is checked, and leave that window open while we set other things up. You may even see a few device targets show up that Chrome's discovered. In my case, apparently my TV can be seen. Odd, but neat.
Enabling the Debugger With a Signal
The most common way to start debugging node is to add the --inspect CLI arg, either directly (via node --inspect <your file>), or in the appropriate env values ( NODE_OPTIONS="--inspect" node <your file>). In production environments, it may not be desirable to enable the debugger on every start; in the case of Heroku which randomly assigns ports, you can't even guarantee the debug port of 9229 is available. But, you can enable the debugger a different way.
From the node.js debugging page
Node.js will also start listening for debugging messages if it receives a SIGUSR1 signal. (SIGUSR1 is not available on Windows.) In Node.js 7 and earlier, this activates the legacy Debugger API. In Node.js 8 and later, it will activate the Inspector API.
Sending a signal is as easy as using the unix kill command, where <PID> is your node.js process ID:
$ kill -usr1 <PID>
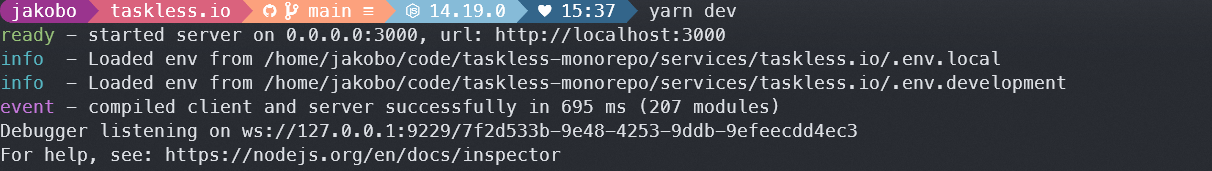
You can try this locally by running ps aux | grep node to find your node.js process, and then using the PID for the above kill command. Personally, I find that the usr1 signal is not only more reliable (works everywhere) but also means you don't have to completely restart the server. When you send usr1, node just sees the signal and starts up its debugger. It'll pop up moments later in the Chrome DevTools.
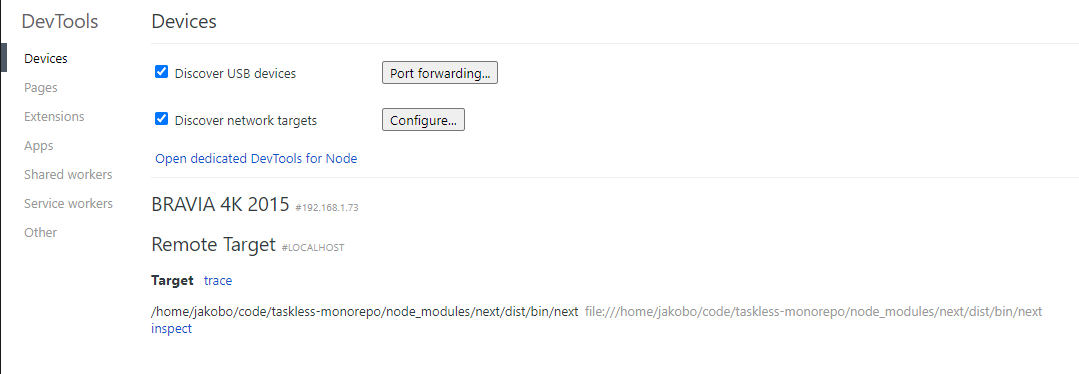
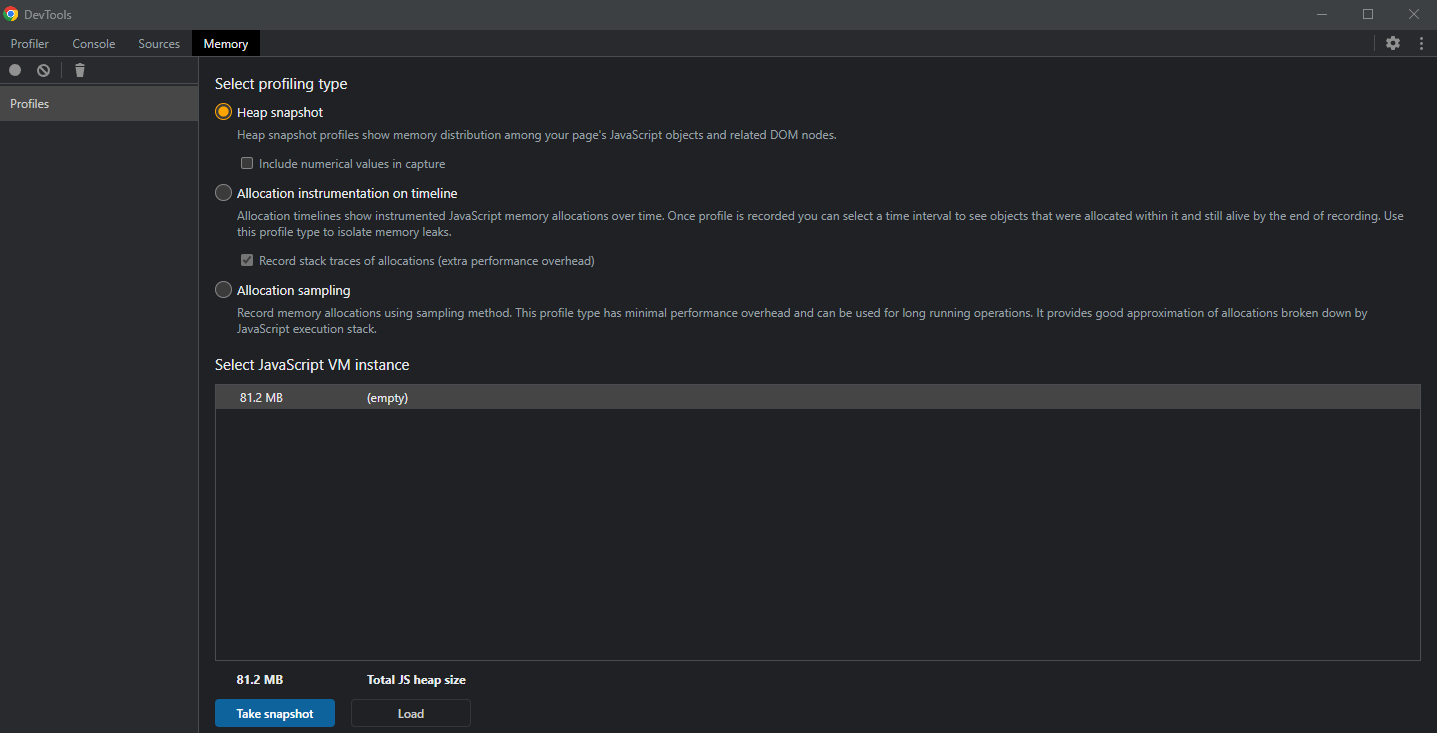
Hit the inspect link and you'll be taken to a very familiar DevTools interface, but optimized for node.js debugging. In addition to the Console and Sources, you'll also have "Profiler" for CPU profiling, and "Memory" for memory usage profiling,
Connecting to Heroku in Production
Once that's all working, it's time to connect to our production instance in Heroku and take some live samples. Close the inspector and local development server if needed, and make sure your heroku command works. If you're using a different environment such as Digital Ocean, look up SSH instructions to get to your host. They'll be different on every provider.
For heroku, there's the ps:exec command which gives you a shell on your default process for dyno 1. Be sure to specify your <APP_NAME> so that you're ssh-ing into the correct box, and if you need to connect to a dyno process that's not web, add the -d <dyno> flag.
$ heroku ps:exec -a <APP_NAME>
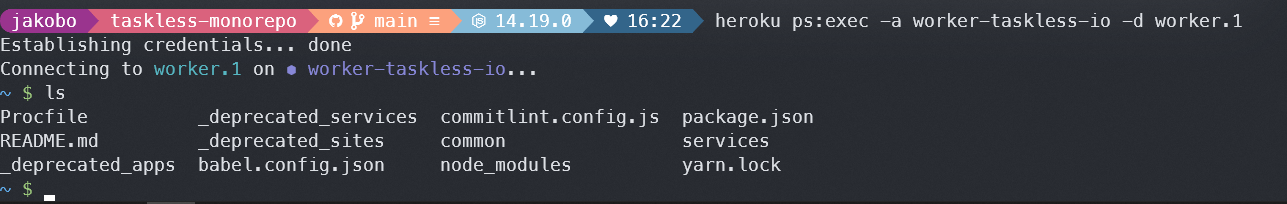
From here, we can search our node process with ps aux | grep node and start the debugger with kill -usr1 <PID>. Our debugger will start, but obviously we can't see it yet. Heroku (and other providers) don't expose port 9229 to the internet for security reasons. Open another terminal window and use heroku's forwarding command to create a local tunnel for your debugger (and add the optional -d flag if needed).
$ heroku ps:forward -a <APP_NAME>
And just like that, your production instance shows up in the Chrome DevTools.
Sampling
Taking samples is straightforward. Wait for the VM instance size to grow, click the trash can icon (force GC) to ensure it's actually grown by a reasonable amount, and then hit the Take Snapshot button to capture a memory heap. Chrome DevTools will be busy for a bit, but it'll create a Heap, which it adds to the left-hand side of the Memory profiler. Every heap is a detailed analysis of what was in JavaScript at that exact moment. Every string, object, key, event, closure, callback; you name it, it's here.
Collect several samples (5-6 is ideal) since you'll be looking for identifiable trends. I also recommend waiting about 2-3 MB between each sample. We want our growth in memory to be noticeable, and whatever's leaking to stick out.
Here, I've got 6 production samples of a leaking app. In the time I sampled, we added about 15MB to the footprint. 😱
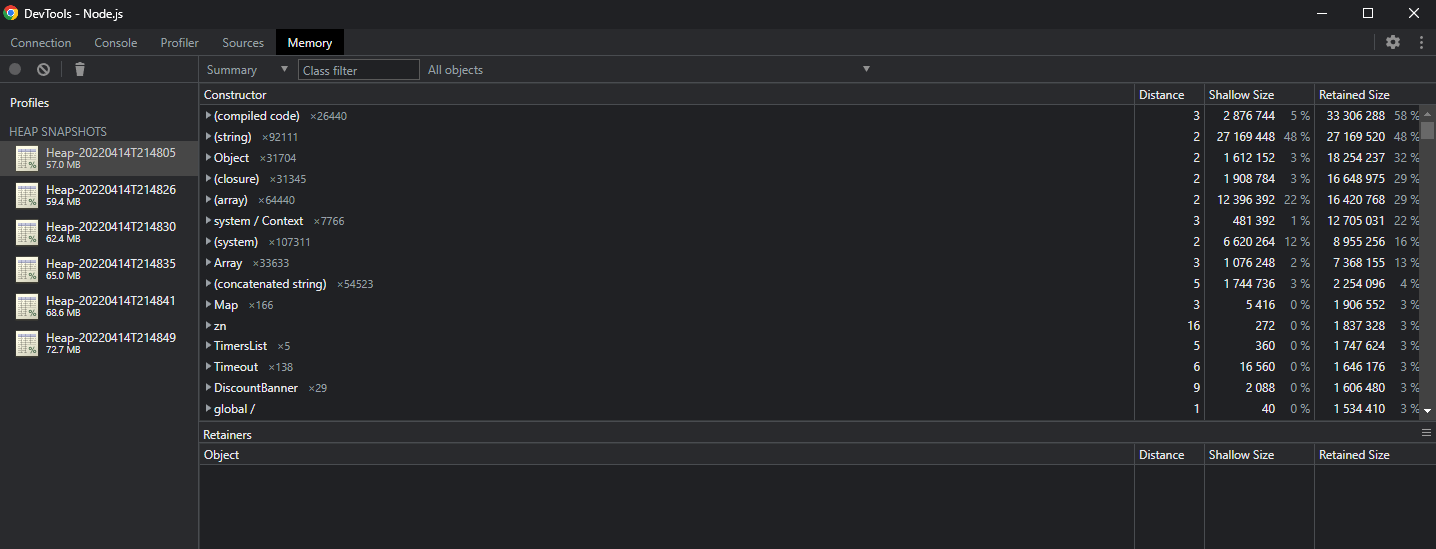
What matters is we can see the memory growing, we have several samples of the Heaps in question (which contain our growing memory), and those Heaps are readable by the Chrome DevTools. We can save the Heaps, disconnect from our production machine (which also closes the debugger), and get to our analysis.
Using Heap Compare
Select the newest (largest) Heap, and above the list of objects in the heap, change from Summary to Comparison. This changes the Heap view from telling you what's in the Heap to what changed between Heaps.
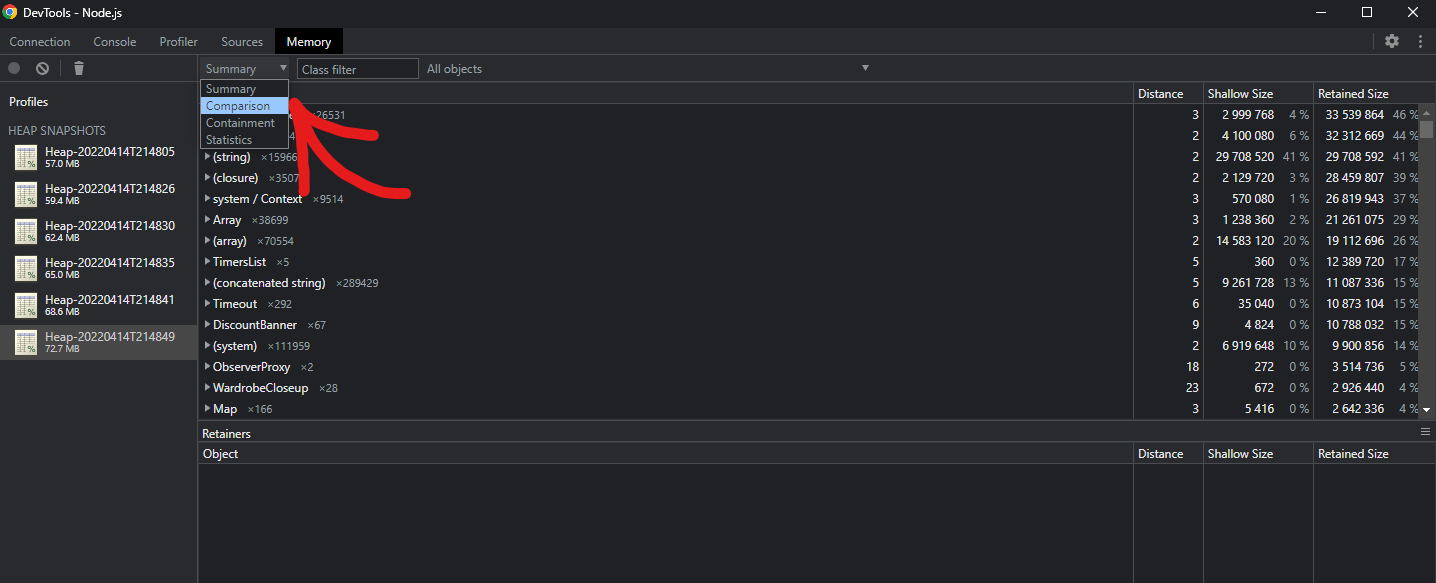
Sort the table by # Delta, and the problem suddenly becomes very obvious.
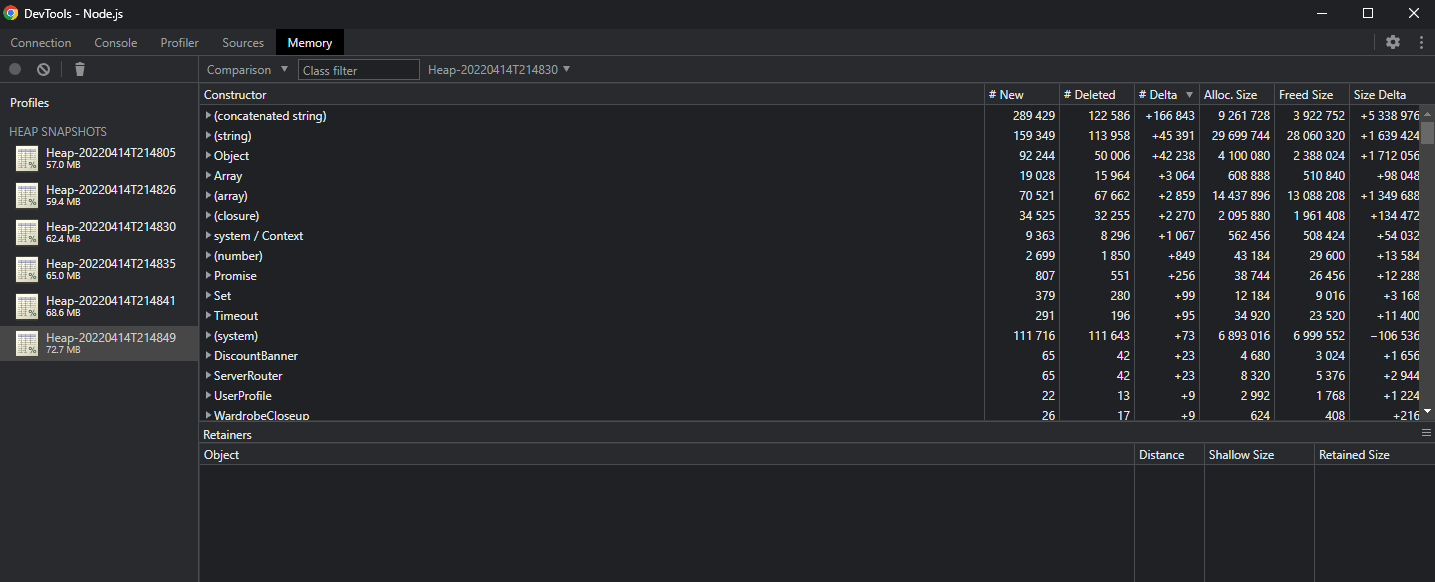
We can compare against a few other Heaps (that's why we captured them) to isolate the source of the memory leak. Here, I'm comparing Heap 5 to Heap 4, where the number of (concatenated string) is much smaller and easier to manage. There's a lot of weird date strings like "-137 days, 21" being created and retained. Clicking on one gives us the full Retainer log. It's part of a larger string, that's part of a larger string, that's in discountTimeLeft in the update cycle of a React component called DiscountBanner, inside of a... Timeout.
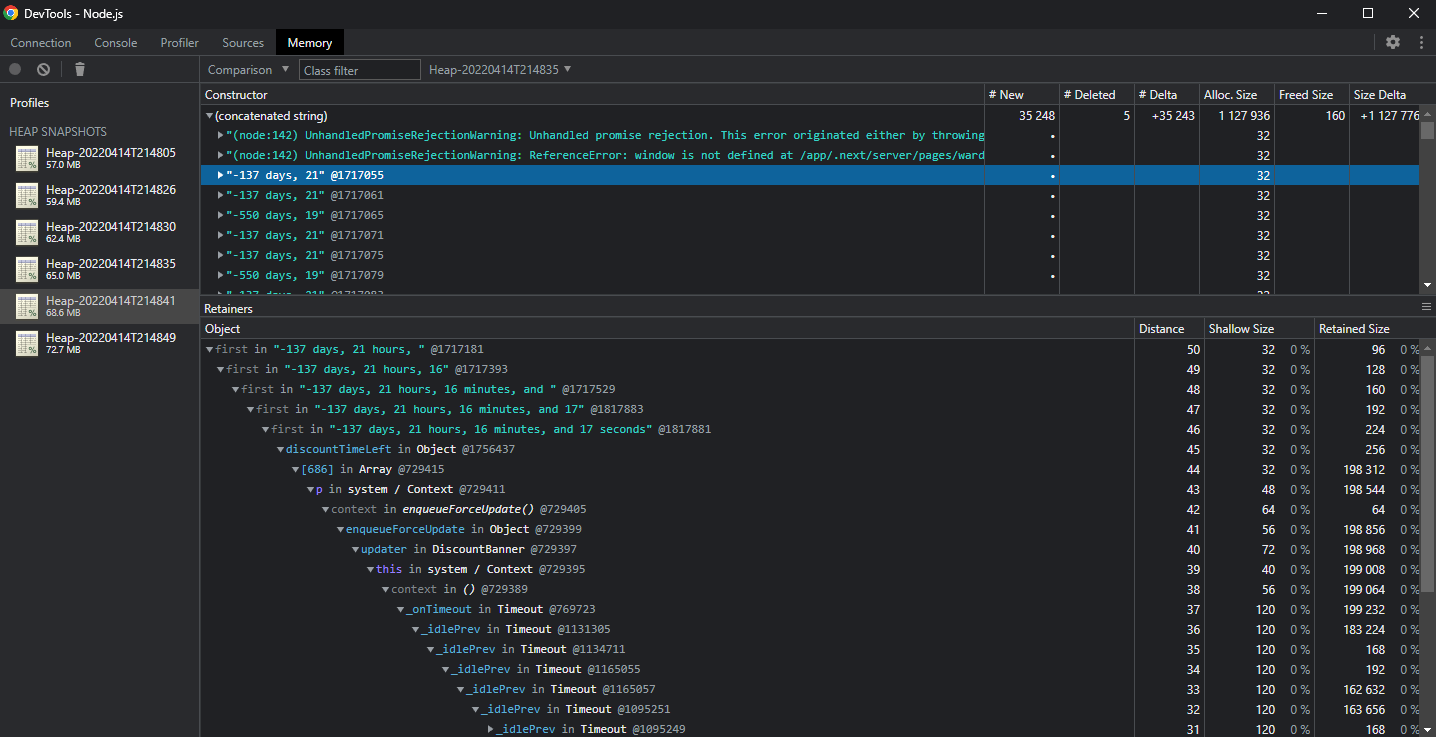
Opening up the DiscountBanner culprit, there's a setInterval in the constructor. Fixing this and redeploying closed the memory leak. It turned out that when next.js was running in Heroku, the setInterval would just keep on running and building its string about how many days were left on the discount. Since that string was locked in the setInterval callback, it could never be garbage collected by v8. Add in a few thousand requests per second, and those discount strings would ultimately take up all of the available memory and cause Heroku to restart the server with an R15 error.
More than Heaps
I only needed the Heap compare, but the CPU profiler and the Memory timeline (Allocation instrumentation on timeline) can help narrow the issue even further in a larger application. The hardest part is getting a reproducible issue. Looking at production not only makes it easier, but ensures you're solving the right problem. And when you're done, you'll never put a setInterval in a React component constructor again. 😆